Network uptime and reliability are non-negotiable in today's digital world. Maintaining complete visibility and control, even during unexpected events, is a critical business advantage. This is exactly the assurance that Graphiant's Global Health Dashboard provides.
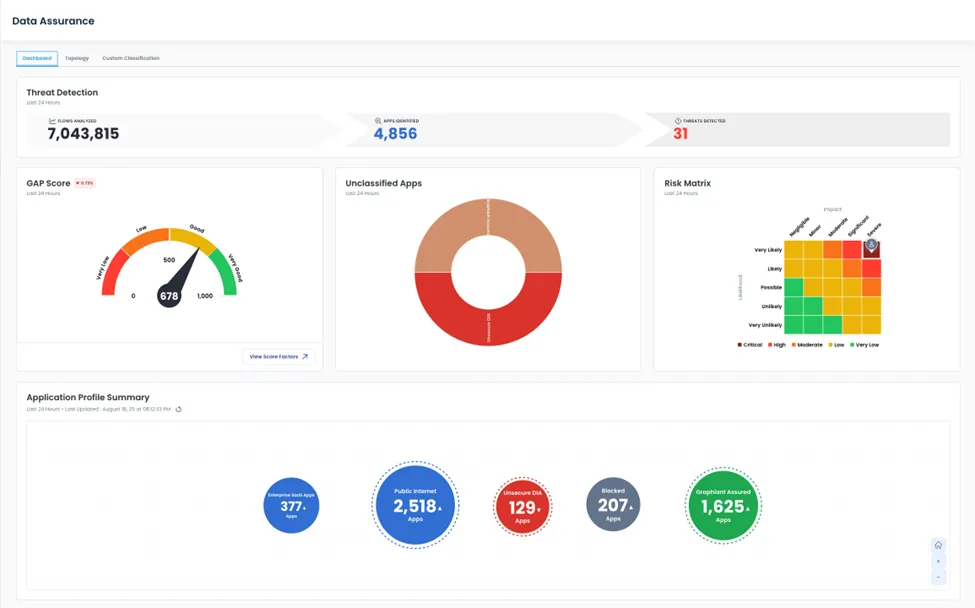
The power behind the Global Health Dashboard is a combination of Graphiant's Data Assurance Platform and the underlying Graphiant Backbone. The Data Assurance Platform provides a unified data foundation for observability, security, and assurance, capturing metadata from every packet to give you total network visibility. This real-time insight into application performance, network latency, and overall health eliminates the need for multiple monitoring tools and empowers you with a single, comprehensive view of your traffic.
This platform is built upon our highly redundant, secure, scalable backbone. Unlike other approaches that rely on fragmented, over-the-internet connections, our backbone is built with multiple layers of redundancy to ensure maximum uptime. Each Point of Presence (POP) is interconnected with multiple providers and diverse paths, guaranteeing that your data always finds the most optimal and reliable route. This global network is designed to be flexible, allowing you to seamlessly scale your network on demand without manual reconfigurations. Furthermore, it's inherently secure, with every packet traveling within an encrypted, zero-trust framework from end to end. This combination of redundancy, flexibility, and security ensures that the data you see on the Global Health Dashboard reflects a resilient and future-ready network.


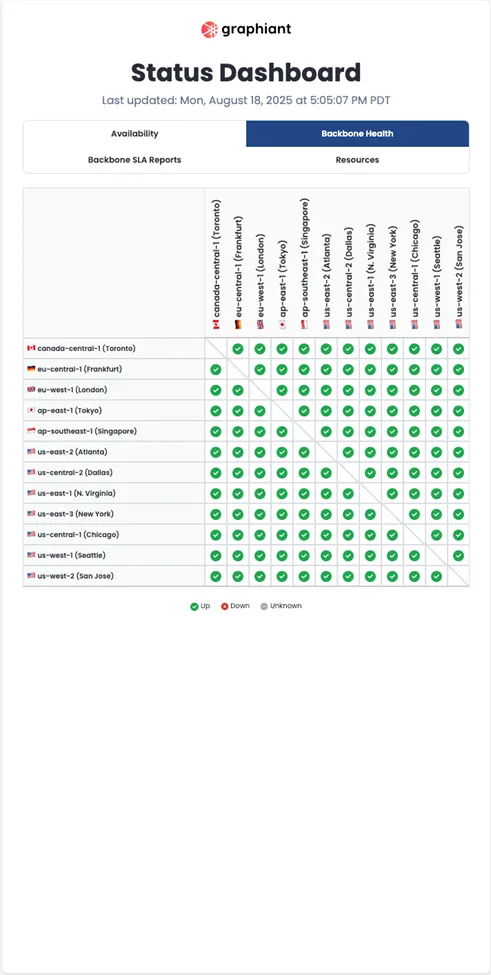
More than a simple monitoring tool, the Global Health Dashboard is your dedicated, public-facing site designed for ultimate network resilience. Think of it as your ultimate source of truth, a beacon of clarity that provides real-time visibility into your NaaS infrastructure, completely independent of the main portal. This dashboard is a key component of Graphiant’s unique approach to Network as a Service, designed from the ground up for modern, cloud-first, and secure environments. It complements the comprehensive view of network health demonstrated in our Site Health Dashboard product demo, which shows how a rules-based streaming engine processes network data to provide clear, actionable alerts. This approach is part of how we differentiate ourselves in the NaaS landscape, as detailed in our blog post on navigating the NaaS landscape, by offering a solution that redefines simplicity, security, and scalability for enterprise-wide WAN needs.
Access Graphiant’s Global Health dashboard at: https://status.graphiant.io/

This standalone solution ensures you always have the critical information you need to make informed decisions, giving you peace of mind and unwavering confidence in your network's health.

Graphiant's Global Health Dashboard is built to deliver real-time insights and empower proactive management. Its clean, intuitive interface gives you immediate access to: For information about how your data is collected and used, please see our Privacy Policy.
The dashboard provides a comprehensive view of your network's well-being, both in the present and over time. You gain:
Our solution is designed for complete transparency, providing a clear window into:


In a world where every minute of uptime is crucial, protecting your network means protecting your revenue, productivity, and customer trust. The Global Health Dashboard empowers you to:
Graphiant's Global Health Dashboard is a pillar of operational confidence. By providing transparent, real-time visibility into your network infrastructure, it ensures that you are always in control and prepared, no matter what.

To see this powerful dashboard in action, visit https://status.graphiant.io/ or for more information on the powerful technology behind our Global Health Dashboard, read Unlocking Total Network Visibility and How You Can Get Observability to learn more.
Author: Prashanth Manthena, Director of Software Engineering – SRE & QA
Resources